Dashboard App FREE Download
Generate code for your dashboard app without programming

What is a Dashboard app?
A dashboard app is an information management software application that visually tracks, analyzes and displays graph, charts, key performance indicators (KPI), metrics and key data points to monitor the health of your business. The Dashboard app is customizable to meet the specific your needs.
Dashboard Builder presents dashboard app, a PHP based application built in Apache + PHP + MySQL + Free Charting Engine, which is designed with drag-and-drop and ease-of-use at top of the mind which is customizable in a number of ways.
Our dashboard app gives you access to live data in Apache Server. Check in on your business anytime on your Phone, Tablet or Personal Computers.
Our dashboard app supports a variety of different charts that includes but not limited to line chart, scatter chart, bar chart, pie chart, donuts chart, bubble chart, stack chart, area chart, heatmap chart, sankey diagrams and choropleth map etc.All these charts are D3.js based dynamic chart. You may like to see D3.js based dynamic Dashboard app Example live. Our Dashboard app can be used to create either static or real-time database driven dashboards with data coming from a variety of sources such as MySQL, MS SQL, SQLite, ORACLE, PostgreSQL, Sybase and Cubrid with no programming required. A part of the community, this dashboard app is designed to integrate with a PHP application you may be using and also import data from MS Excel and CSV files.
Getting Started
In our Dashboard app example, we are going to build a simple dashboard and then will generate PHP source code for our web application. For this, we will be demonstrating with our freely available open-source drag and drop based Dashboard app. To install and run the Dashboard app, following are the requirements.
Requirements
Our Dashboard app can be installed any platforms like Windows, Linux and Ubuntu or any other platforms support Apache, Nginx etc.
- PHP Version 5.6 or later
- Apache 2 or later
- Windows 7 or later /Linux 3 or later
- Firefox 52, Chrome 57, IE 8
Installation
There is a Free version of Dashboard app available for trail bases,
- Download from https://dashboardbuilder.net/download-free-dashboard
- Place the files in a directory on the web server. e.g.
…/www/yoursite/dashbboardbuilder-v3-FREE/ - Unzip dashboardbuilder_free_v.30.zip the file using Extract Here option to the root folder of “dashboardbuilder”.
Dashboard app examples
Before really going into connecting the database and fetching the data, Make sure that your Web Server (like Apache, Nginx, etc) is configured to display documents in the folder which will contain dashboard. Read-Write permission to the folders and sub-folders of dashboardbuilder i.e chmod -R 777 dashbboardbuilder-v3-FREE. Check your browser inspector/console to make sure that there isn’t any error being reported, and all the Dashboard builder files are being loaded properly.
STEP-1: Connect with your Database
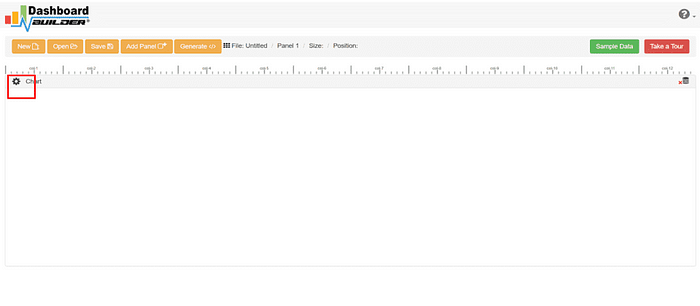
- Run the web folder in your browser. e.g. http://localhost/dashboarduiler following welcome screen will appear.

- This is the main panel of the Dashboard app. This is a HTML5 based fully responsive interface built in PHP, HTML, JavaScript and CSS. The interface has a minimal design with a drag-and-drop feature that allows you to add multiple chart panel to customize the dashboard on according to the way you want.
- Now Click the Database icon.
- Following screen will appear. In our dashboard app example, we will use the sample SQLite database called Northwind.db to connect and fetch the data. Now, Select Database from data source tab. Select SQLite from the drop down list of Database, Enter your
"../data/Northwind.db"in the DB name field and Save changes as mentioned in the screen.

When you click the save changes, a green tick mark with Database will appear that shows that your database is successfully connected.
STEP-2: Chart settings
- In our next step, we will fetch data from the database we have just connected. Select the gear icon for your Chart preference.
The following screen will appear. List of the tables from Northwind.db will appear on the table list as shown in the picture below.

STEP-3: SQL statements
- In our example, we will be creating a simple Dashboard app for our sales management. This dashboard app will contain a chart where users can find the sales stats and maintain the data about the products.
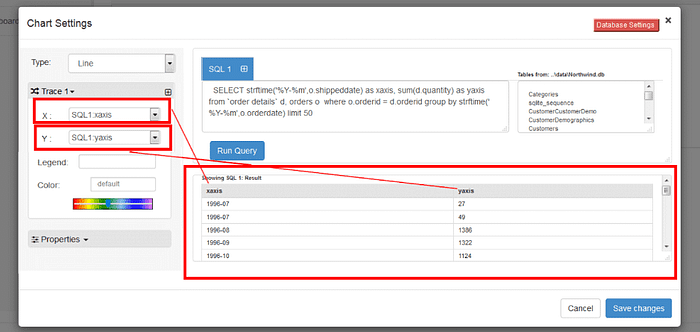
- Now, enter the following SQL statement in text box in a following manner
SELECT strftime('%Y-%m',o.shippeddate) as xaxis, sum(d.quantity) as yaxis from `order details` d, orders o where o.orderid = d.orderid group by strftime('%Y-%m',o.orderdate) limit 50
- Now, we want to execute our query and fetch the data from the tables. Click the Run Query button
- Query Result will appear. Now, we have to assign x-axis data to the x-axis column and y-axis data to the y-axis column. Select your x-axis data from the drop down list of X and y-axis data from the drop down list of Y .
- Click Save Changes
Charts will be appeared on the screen as shown below.

STEP-4: Adjust the position
- You may adjust the size and the position of the Chart Panel by dragging its corner. The size and position are fully responsive according to the Bootstrap framework.
STEP-5: Code generation
- So far we have successfully build our dashboard. In this step we are going to generate PHP source code for dashboard we have just created. Click the Generate button to auto-generate PHP source code for our dashboard.
- PHP code for the chart will automatically generate, you may copy past this code to your Dashboard app.
Auto-generated PHP source code
Following is an example of auto-generated PHP source code. You may copy & paste the following PHP source code in your web application.
/**
 * DashboardBuilder
 *
 * @author Diginix Technologies www.diginixtech.com
 * Support  - http://www.dashboardbuilder.net
 * @copyright (C) 2018 Dashboardbuilder.net
 * @version 2.1.5
 * @license: license.txt
 */

include("inc/dashboard_dist.php");  // copy this file to inc folder


// for chart #1
$data = new dashboardbuilder();
$data->type =  "line";

$data->source =  "Database";
$data->rdbms =  "sqlite";
$data->servername =  "";
$data->username =  "";
$data->password =  "";
$data->dbname =  "data\Northwind.db";
$data->xaxisSQL[0]=  "SELECT strftime(^%Y-%m^,o.shippeddate) as xaxis, sum(d.quantity) as yaxis from `order details` d, orders o  where o.orderid = d.orderid group by strftime(^%Y-%m^,o.orderdate) limit 50";
$data->xaxisCol[0]=  "xaxis";
$data->yaxisSQL[0]=  "SELECT strftime(^%Y-%m^,o.shippeddate) as xaxis, sum(d.quantity) as yaxis from `order details` d, orders o  where o.orderid = d.orderid group by strftime(^%Y-%m^,o.orderdate) limit 50";
$data->yaxisCol[0]=  "yaxis";
$data->name = "linechart";
$data->title = "Line Chart";
$data->orientation = "";
$data->xaxistitle = "x-axis title";
$data->yaxistitle = "y-axis title";
$data->showgrid = "";
$data->showline = "";
$data->height = "167";
$data->width = "";
$data->col = "0";
$result[0] = $data->result();

?>

<!DOCTYPE html>
<html>
<head>
	<script src="assets/js/dashboard.min.js"></script> <!-- copy this file to assets/js folder -->
	<link rel="stylesheet" href="//maxcdn.bootstrapcdn.com/bootstrap/3.2.0/css/bootstrap.min.css"> <!-- Bootstrap CSS file, change the path accordingly -->

<style>
@media screen and (min-width: 960px) {
.id0 {position:absolute;margin-top:67px;}

}
.panel-heading {line-height:0.7em;}
#kpi {font-size:34px; font-weight:bold;text-align:center;}
#kpi_legand {font-size:11px; color:#999;text-align:center;}
</style>


</head>
<body>

<div class="container-fluid main-container">
<div class="col-md-12 col-lg-12 col-xs-12">
<div class="row">
<div class="col-md-4 col-lg-4 col-md-offset-4 col-lg-offset-4 col-xs-12 id0">
<div class="panel panel-default">
<div class="panel-heading">Line Chart</div>
    <div class="panel-body">
        <?php echo $result[0];?>
    </div>
</div>
</div>
</div>
</div>
</div>
</body>
This auto-generated PHP code is under MIT license, which you may customize as per your desire needs and can be used an anywhere you want. You can find the complete information about the license here.
Conclusion
Now we have a PHP based dashboard that can be used with any web application that was customized to fit the requirements of the web design. The project also offers free and paid plans. You can also download Dashboard app FREE version. The code for Dashboard app can be found on GitHub under this license
Best of all, with our Standard and Enterprise licenses include 100% source code, for you to enhance the functionality or incorporate Dashboard app into your web application or any PHP software solutions/products, analytics/data science/data warehouse enterprise systems or Joomla, Wordpress or Drupal sites.
All editions of our Dashboard app series are still fully functional, for sale and supported and provides increasing levels of support to address the queries of users and developers.
Our Dashboard app can also be implemented using an online API where you don’t have to mix with PHP code. The online API uses universal HTML code which can be used in any platform. The data will be added or retrieved from the database using the API. You may find more information about the Online Dashboard.
You may want to take a look at our complete documentation and video tours of the latest version along with a live tour of user interface and step by step instructions for performing key features.
